
prometheus
架构图
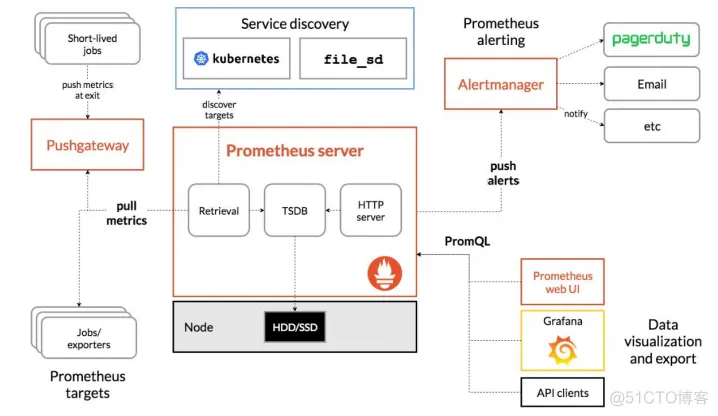
prometheus-server
TIP
如果在调试的时候需要查看请求的日志, 在启动脚本中新增--log.level=debug配置
exporter
集合不同节点数据
主配置
组配置
pushgetway
启动
prometheus
在prometheus.yaml中增加:
推送数据
一般uri格式为/metrics/job/<job_name>/instance/<instance_name>
grafana
数据源
添加Prometheus,修改HTTP中的url为http://10.0.18.2:9090
仪表盘
在https://grafana.com/grafana/dashboards/中寻找模板
推荐模板:
-
postgres:https://grafana.com/grafana/dashboards/9628-postgresql-database/
-
mysql:https://grafana.com/grafana/dashboards/7362-mysql-overview/
在mysql的仪表盘中可以添加一个监控项
mysql_version_info{instance="$host"}
options中选择instant,legend填写{{version}}
右侧选择stat,Text mode选择Name